TAM, SAM, SOM: A Bottom-Up B2B Market Sizing Example
Calculate TAM, SAM and SOM from verified B2B account units, comparable prices and team capacity. Includes a fictional worked example and an evidence ledger.
By Lead Scorer 8 min read
TAM, SAM and SOM describe three different revenue opportunities: the full market for a defined offer, the part you can serve, and the part you could realistically win over a stated period. For B2B prospecting, their value lies in the assumptions underneath the numbers. Count the wrong unit, include an unsupported use case, or ignore delivery capacity, and a neat calculation becomes a poor sales plan.
Define the offer before sizing the market
Imagine selling software for coordinating maintenance visits. “Every business that maintains equipment” is too loose a boundary. A usable definition would specify the workflow, the customer unit, the service offered and the price basis. A provider selling one subscription per operating company must count differently from a provider charging for each location.
Write a sentence that another researcher could apply: “We sell an annual scheduling subscription to independent maintenance contractors that manage recurring visits through a shared dispatch team.” That sentence is illustrative. Its purpose is to expose exclusions before a database produces an impressive count.
An ideal customer profile describes which accounts fit. Market sizing asks how many qualifying units exist and what revenue the offer represents. Neither task proves that those accounts are buying now. Keep market membership, product fit and purchase intent as separate fields.
What do TAM, SAM and SOM mean?
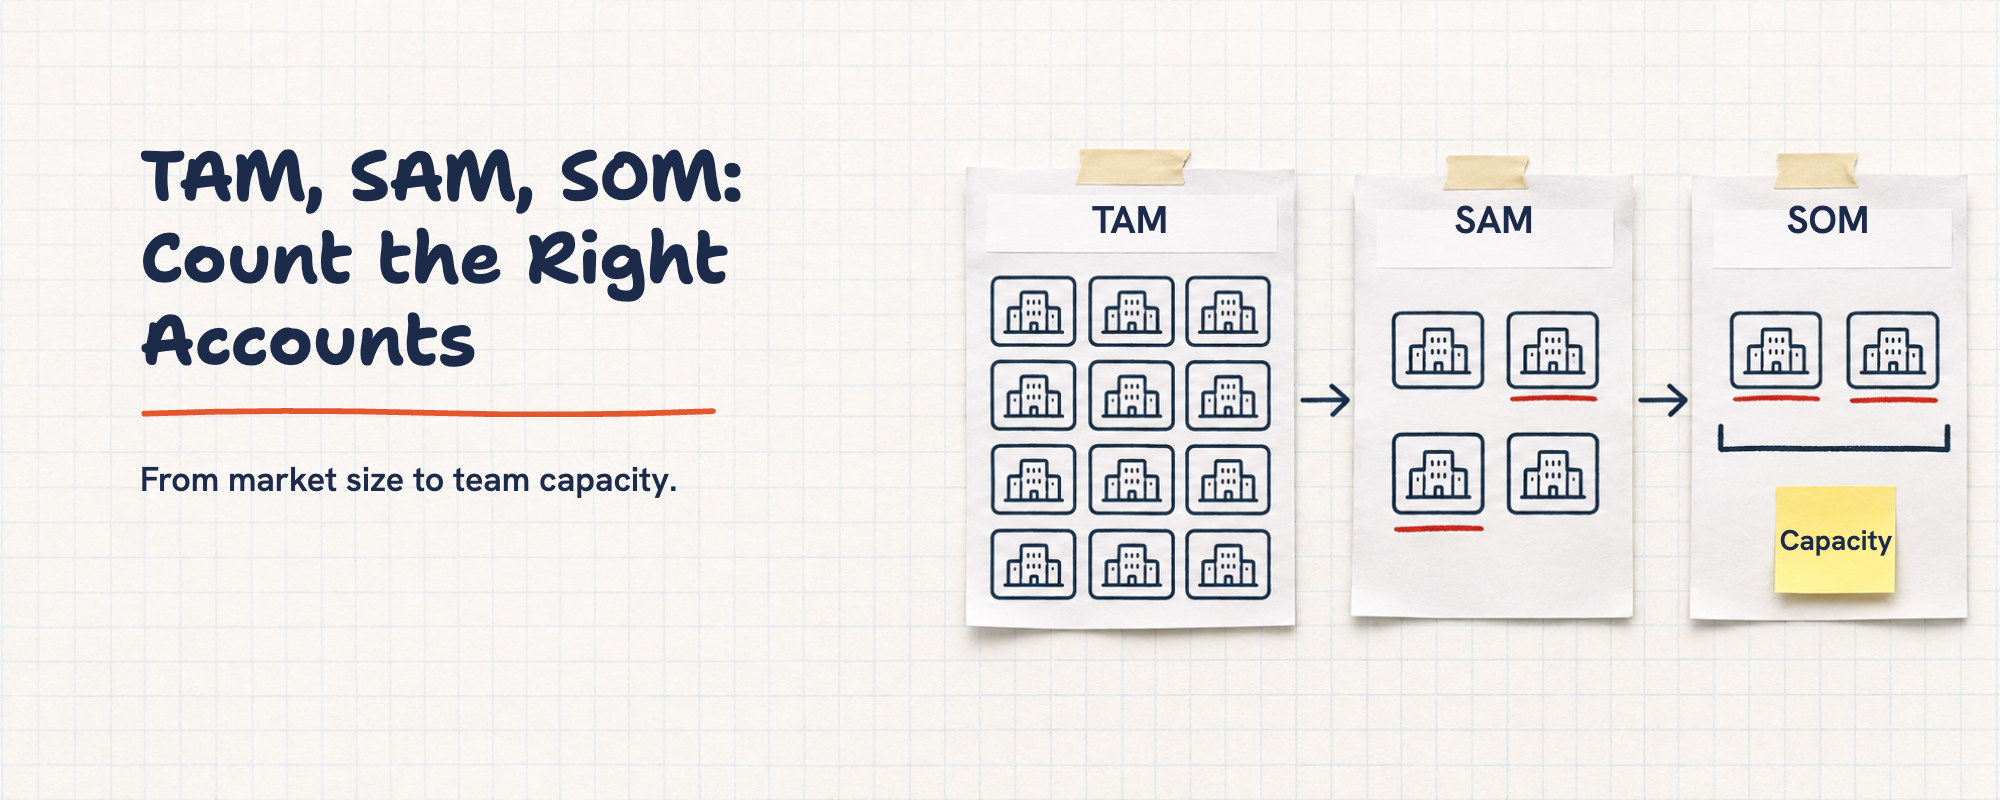
- TAM, total addressable market: the annual revenue opportunity across the defined market.
- SAM, serviceable addressable market: the portion your offer and operating model can serve.
- SOM, serviceable obtainable market: the portion you can plausibly capture within a stated horizon.
These definitions are consistent with Stripe's market sizing guide. Specify the scope and units beside every figure. A count of customer accounts is useful, but label it as a count; multiplying it by a comparable annual price produces a revenue estimate.
The three figures should form nested sets under the same assumptions. If your SOM exceeds your SAM, check for a different time period, customer unit or revenue basis. A larger future product can have a different market, but it belongs in a separately labeled scenario.
The podcast lesson: two companies can count different markets
In Startups for the Rest of Us, episode 844, Wash-Dry-Fold POS cofounder Brian Henderson describes a focus on laundromats offering drop-off or pickup-and-delivery services at a meaningful volume. He contrasts that boundary with a competitor's broader view of laundry activity. This is his account of their positioning, not an independently measured market comparison.
The useful lesson is to inspect the boundary before comparing the totals. A bigger number may describe a different offer. The worksheet below is our proposed method, not Henderson's calculation. We do not infer his TAM, price, market share or acquisition capacity from the interview.
The separate Wash-Dry-Fold POS first-customer course examines pre-sales and manual fulfillment. Here the task is different: construct an auditable market estimate before allocating prospecting effort.
Build a bottom-up TAM with an evidence ledger
Start with a candidate account universe and retain its provenance. Record the source, extraction date, geography, unit counted and inclusion rule. A list of locations cannot silently become a list of independent buyers. Likewise, several brands may share a purchasing organization while one company may operate sites that buy separately.
Use a short ledger:
| Field | What to record | Question to resolve |
|---|---|---|
| Unit | Company, group, site or other paid unit | What does one contract cover? |
| Identity | Stable account identifier and parent link | Is this a duplicate or a distinct buyer? |
| Eligibility | Evidence for the required workflow | Does the account actually do the work? |
| Source | Link, date and observation | Can another person reproduce the classification? |
| Status | Included, excluded or unknown | Is missing evidence being mistaken for a negative? |
| Price basis | Comparable annual amount and scope | Is hardware, setup or another offer mixed in? |
A category label can help find candidates. It does not establish every operational requirement. Inspect a sample, record false matches and refine the search. Do not extrapolate one hand-picked sample's fit rate to the entire market as if it were representative.
For a uniform offer, the basic formula is eligible units × annual revenue per unit. With different plans or customer types, calculate each segment separately and add the results. Preserve exclusions so the next analyst can explain why the number changed.
Narrow the SAM using current service constraints
Apply explicit operating limits to the TAM. These might include supported countries, working language, required integrations, implementation model or account size. Use constraints your team can explain and maintain. “Easy to close” is not a serviceability criterion unless you have defined the observable condition behind it.
Separate a product limitation from an evidence gap. An account that needs an unsupported integration can be excluded from the current SAM. An account whose integration requirements are unknown should remain unknown until checked. Otherwise, the estimate quietly rewards incomplete research.
Keep future capabilities outside the current scenario. If an integration becomes available, date the change and recalculate the affected subset. Do not count a roadmap item as something sales can promise today.
A fictional TAM, SAM, SOM example
Consider a fictional maintenance scheduling vendor. All counts, prices and conversion assumptions below are invented to explain the calculation; they are not market data or Lead Scorer results. The commercial unit is one operating company, and the annual subscription is $2,400 with the same scope throughout.
| Layer | Assumption | Calculation |
|---|---|---|
| TAM | 8,000 companies fit the defined workflow | 8,000 × $2,400 = $19.2 million annual opportunity |
| SAM | 1,500 fit today's language, geography and delivery constraints | 1,500 × $2,400 = $3.6 million annual opportunity |
| Acquisition scenario | 300 distinct accounts can receive adequate research and follow-through in the next 12 months; assumed account-to-win rate 8% | 300 × 8% = 24 potential wins |
| Delivery constraint | The team can onboard 18 additional customers in that period | The smaller of 24 and 18 is 18 |
| SOM scenario | 18 customers at the same annual subscription | 18 × $2,400 = $43,200 in annual contract value |
The 8% assumption requires a comparable historical cohort before it becomes useful for planning. If none exists, show several assumptions and identify what a pilot must measure. Account capacity means distinct accounts worked properly, not email sends or contacts collected.
The $43,200 is annualized contract value associated with the scenario. It is not necessarily cash collected or revenue recognized during the year: closing dates and contract terms matter. Nor is the SOM a forecast simply because it has a formula. For committed revenue planning, use an explicit sales forecasting method and its evidence requirements.
Test the assumptions that can change the decision
Before using the estimate to hire or buy data, vary the uncertain inputs. In the fictional example, a 4% account-to-win assumption produces 12 wins and $28,800 in annual contract value. At 12%, acquisition suggests 36 wins, but the same onboarding limit still caps the scenario at 18. Improving outreach alone would not remove that delivery constraint.
Also test whether the paid unit is correct. If branches share a contract, counting each branch at the full company price overstates the opportunity. If a group buys a multi-site package, use that package's actual pricing logic instead of multiplying a site count by an unrelated average.
Give unknown accounts a visible place. You can report a confirmed lower bound and a conditional upper case that includes unresolved candidates. Label the latter as conditional, list the missing checks and avoid presenting the midpoint as measured truth.
Turn the estimate into a bounded prospecting test
Choose one SAM segment and ask what evidence could invalidate it. Perhaps the workflow is uncommon, the presumed buyer does not control purchasing, or implementation effort makes the offer unsuitable. Review a small, deliberately described set of accounts before expanding the list. Record how the set was chosen; exploratory interviews are not a statistically representative survey.
Lead Scorer can support account research, qualification and reviewed outreach preparation. Treat the resulting list as a working subset with dated evidence. It does not establish an exhaustive market census or a verified probability of winning. Use B2B segmentation to keep materially different motions separate.
Finish with a one-page decision record: offer and unit, TAM boundary, SAM exclusions, SOM horizon, price basis, acquisition and delivery assumptions, unknowns, and next review trigger. A new geography, changed price, revised contract unit or repeated disqualification should prompt a recalculation. The useful outcome is a sales decision someone can inspect and revise.
Frequently asked questions
What do TAM, SAM and SOM stand for?
TAM is total addressable market, SAM is serviceable addressable market, and SOM is serviceable obtainable market. Define the offer, annual revenue basis and time horizon alongside these nested market estimates.
How do you calculate TAM, SAM and SOM in B2B?
Count eligible paid units and apply comparable annual revenue per unit for TAM. Apply current service constraints for SAM. Build a SOM scenario from plausible account acquisition and delivery capacity over a stated period.
Is SOM always 1% of SAM?
No fixed percentage establishes a credible SOM. Explain how accounts can be reached, won and served, and test the assumptions against comparable evidence. The illustrative percentages in this guide are not benchmarks.
Is a market estimate the same as a revenue forecast?
No. Market opportunity, annualized contract value, recognized revenue and cash collected are different measures. A SOM scenario needs a stated horizon and assumptions; a forecast requires separate evidence about expected sales.