Sales Velocity: Compare Segments Before Chasing Bigger Deals
Calculate sales velocity by customer segment with a worked example, consistent inputs and sensitivity checks before assigning more prospecting effort.
By Lead Scorer 8 min read
Sales velocity combines the number of qualified opportunities, average deal value, win rate and sales cycle length. Its most useful application for a small B2B team is often a choice: which customer segment deserves the next block of prospecting time? Calculate the metric separately for comparable segments before letting the largest possible contract set the agenda.
What sales velocity measures
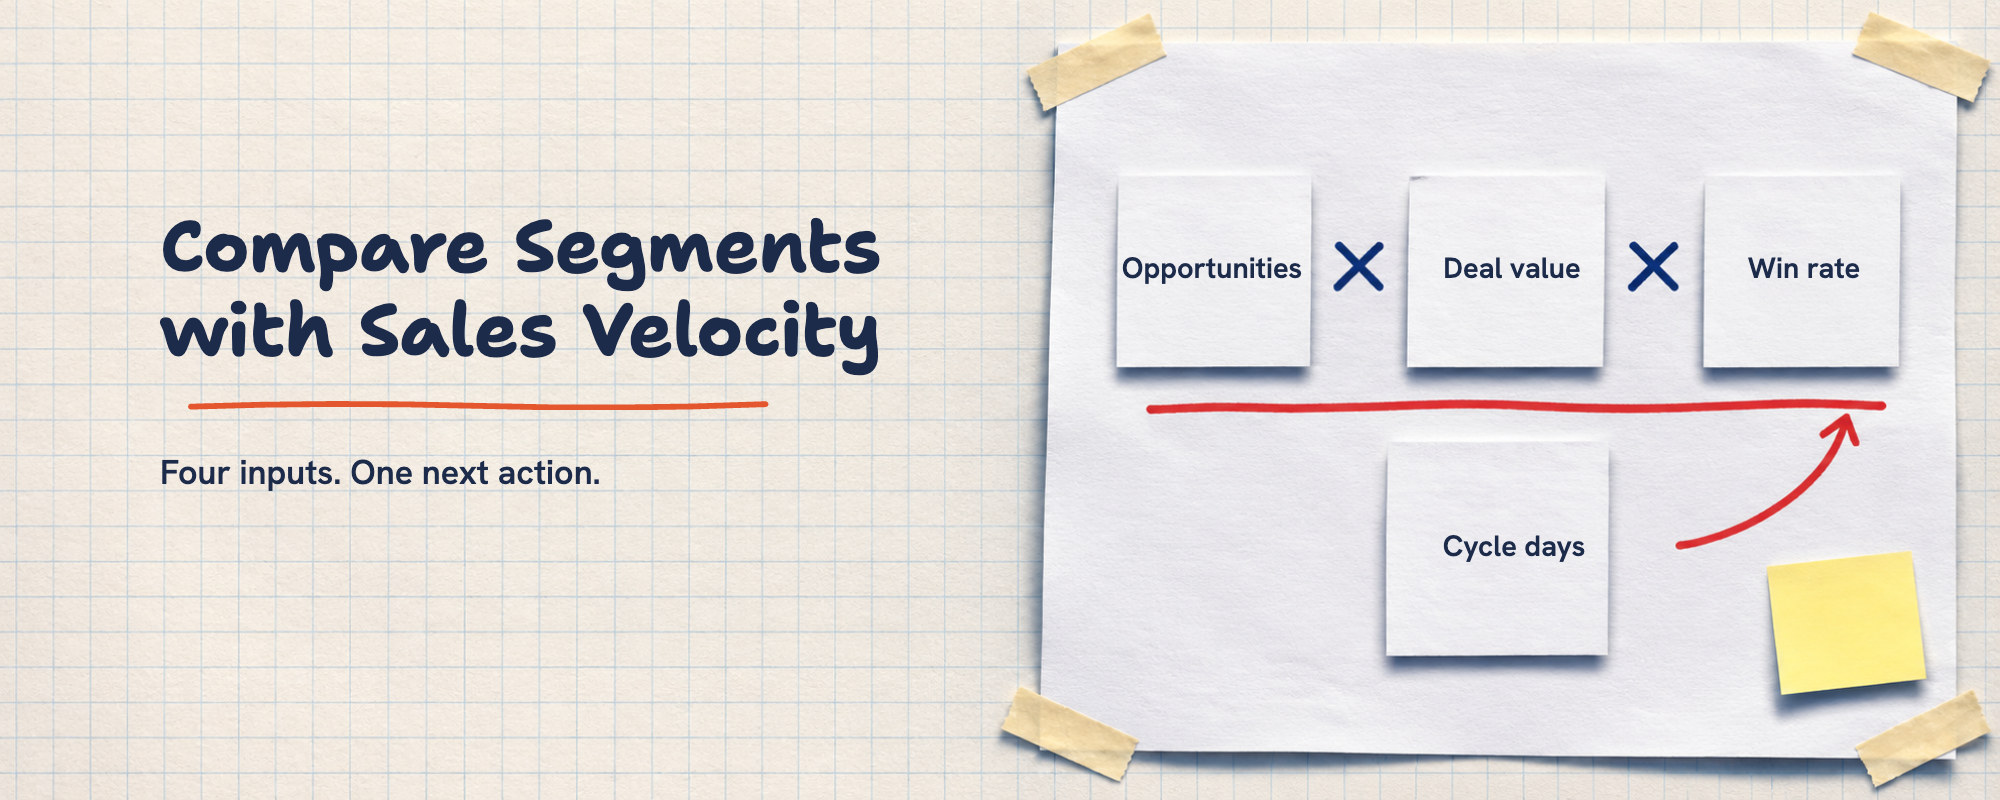
The conventional formula, also documented by Salesforce, is:
Sales velocity = qualified opportunities × average deal value × win rate ÷ average sales cycle in days.
Enter a 25% win rate as 0.25. With contract value expressed in dollars and the cycle in days, the output has units of dollars per day. Treat it as a model for comparing pipeline flow under stated assumptions. It is not the amount that will land in the bank tomorrow, a revenue recognition schedule or a guaranteed forecast.
A segment with larger deals can produce a lower result if its cycle is much longer. Conversely, a short cycle alone does not make a segment attractive: weak qualification, low conversion or expensive delivery can overturn the decision.
Sales cycle length isolates elapsed time. Sales velocity puts time beside volume, value and conversion. That combination makes it useful when two segments are competing for the same team's attention.
The podcast lesson: compare the whole sales motion
In episode 843 of Startups For the Rest of Us, published on July 28, 2026, SaaS coach Julien Marzouk describes founders pursuing several customer types and acquisition motions at once. He uses a compliance software company's bank segments to explain how sales velocity can help sequence that work.
In his account, regional banks offered larger contracts than community banks, but the regional sales cycle was substantially longer. His recommendation was to focus near-term effort on the more suitable motion while leaving the other segment for later. The useful lesson is to examine the complete equation before choosing where to spend time.
This is a practitioner's account, not a published experiment. The episode does not supply the underlying opportunity counts, win rates or account-level dataset. It cannot establish a revenue multiplier for another business. The calculations below use explicitly fictional numbers so every input can be checked.
A worked example: the smaller contract wins the comparison
Imagine a software company selling to two customer segments. The currency is USD and deal value means first-year contract value in both rows. The same qualification threshold and calendar-day clock apply throughout.
| Input | Larger accounts | Smaller accounts |
|---|---|---|
| Qualified opportunities open at the snapshot | 20 | 20 |
| Average value of won contracts | $20,000 | $10,000 |
| Historical win rate by opportunity count | 25% | 30% |
| Average cycle of won opportunities | 100 days | 30 days |
| Calculated sales velocity | $1,000/day | $2,000/day |
Larger accounts: 20 × $20,000 × 0.25 ÷ 100 = $1,000/day.
Smaller accounts: 20 × $10,000 × 0.30 ÷ 30 = $2,000/day.
The larger account contract is twice as valuable, yet the smaller account segment produces twice the modeled velocity. That is a reason to investigate the segment, not proof that moving every rep there would double revenue. The formula does not account for whether additional opportunities are available at the same acquisition cost.
For illustration, suppose the historical win rates came from 20 wins among 80 closed opportunities and 30 wins among 100 closed opportunities. Those are different denominators from the 20 open opportunities in each row. Label both populations. Otherwise, a spreadsheet can quietly mix a current pipeline snapshot with an unexplained conversion percentage.
Define the inputs before comparing segments
Count opportunities, not names on a list
Choose the evidence required for an opportunity to enter the calculation. For example, the buyer has confirmed a relevant problem and agreed to explore a next step. Apply that threshold to both segments.
An account that matches your B2B customer segmentation criteria is still a prospect. Adding a purchased contact list to the numerator would increase the calculated result without creating buyer conversations. Keep prospecting activity and qualified pipeline in separate columns.
Use one contract value convention
Do not compare the annual contract value of one segment with three years of committed revenue in another. Write down whether the figure includes implementation fees, discounts, usage estimates or only contracted recurring value. Use the same currency and basis for both rows.
Keep the arithmetic average for this calculation, and inspect the distribution beside it. If one exceptional contract dominates the average, show that fact before making a staffing decision. Replacing the mean with a median creates a different model; it should be labeled rather than silently substituted.
Give the win rate a visible denominator
A practical convention is won opportunities divided by won plus lost opportunities, counted rather than weighted by contract amount. Record the selection period, the number of wins and losses, and how no-decision outcomes are treated. See our guide to sales conversion rate for the cohort problem.
Open opportunities are not losses. An immature cohort with many unresolved deals needs to remain visibly incomplete. Even closed-only results can favor faster wins while slower deals are still open, so do not assume that excluding the open rows removes every bias.
Start and stop the clock consistently
For this example, cycle length runs from the agreed qualification event to closed-won, measured in calendar days. Use that rule for both segments and show the historical window. Keep lost-deal duration and the age of still-open opportunities alongside the metric as diagnostics.
A segment can look fast when old unresolved deals are omitted. Read several underlying records before interpreting a shorter average as an improvement in the process.
Turn the comparison into a prospecting decision
Start with a worksheet containing two segments, four inputs, the source period and a note on missing data. Add three questions outside the formula: can the team reach more suitable accounts, how much work does selling take, and can delivery serve the customers profitably?
Then choose one reversible change. In the fictional example, that could mean assigning the next research block to smaller accounts while continuing already active larger-account conversations. State what would cause the decision to be revisited. An increase in unqualified meetings or a fall in average contract value should be visible before the team expands the approach.
Keep the account selection criteria stable during the trial. If you simultaneously change the offer, qualification threshold and target geography, the next comparison will describe a different system. It will not isolate which change helped.
Record actual outcomes separately from modeled velocity: accounts researched, conversations, qualified opportunities, wins, losses, unresolved deals and selling effort. The metric can suggest where to investigate; those records show what happened.
Check how easily the result could reverse
In the example, reducing the smaller-account win rate from 30% to 15% changes the calculation to 20 × $10,000 × 0.15 ÷ 30 = $1,000/day. The apparent advantage disappears. The same happens if its average cycle rises from 30 to 60 days while other inputs stay unchanged.
These are sensitivity checks, not predictions that the inputs will move independently. A lower price might affect both win rate and deal value; a different qualification threshold might change volume and cycle length together. Recalculate the complete row rather than celebrating an isolated percentage improvement.
If a small adjustment reverses the ranking, use the comparison to frame a question and collect more evidence. There is no universal sample size or sales velocity benchmark that makes different products, markets and contract models directly comparable.
Where sales velocity stops being enough
The formula leaves out gross margin, acquisition cost, implementation load, retention, payment timing and strategic value. A lower-velocity segment may still be worth developing because it has better economics or opens an important market. Make that reason explicit rather than hiding it inside an optimistic input.
Current opportunity counts also reflect past prospecting effort. A segment can lead simply because it received most of the team's attention. Sales velocity by itself cannot tell you the return on one additional hour of research. Pair it with effort records and reachable-account estimates before shifting capacity.
Use a sales dashboard to keep these supporting measures visible. Sales velocity should help explain a decision, not replace all the other evidence on the dashboard.
Prepare the segment comparison in Lead Scorer
Begin upstream of the calculation: keep account criteria, research evidence and exclusions inspectable. Lead Scorer can support account research and prioritization; the sales velocity worksheet still needs opportunity outcomes, values and dates from your sales records.
Do not treat an account score as a win probability, and do not treat public company information as a named person's buying intent. Review the account context, choose whom to approach and confirm the problem through a conversation before classifying the opportunity.
The next useful action is small: pick two existing segments, write down a common qualification rule, and calculate both rows with visible denominators. If the data is missing, the first task is to improve the records. A precise blank is more useful than a confident invented number.
Frequently asked questions
What is the sales velocity formula?
Multiply qualified opportunities by average deal value and win rate, then divide by average sales cycle length. Enter the win rate as a decimal and use the same currency, contract value basis and time convention across segments.
Is sales velocity the same as sales cycle length?
No. Sales cycle length measures elapsed time. Sales velocity combines time with opportunity volume, contract value and conversion to model pipeline flow.
Does a higher sales velocity guarantee more revenue?
No. The model depends on historical inputs and current opportunity counts. It excludes acquisition cost, margin, delivery capacity, retention and payment timing, and does not guarantee future results.
How do you compare sales velocity across segments?
Use consistent qualification, value and cycle definitions; show the win-rate denominators and unresolved deals. Check selling effort and reachable accounts, then test whether plausible input changes reverse the ranking.