Sales Conversion Rate: Calculate the Right B2B Rate at Every Stage
Calculate sales conversion rates without mixing leads, opportunities, and open deals. Use a cohort-based B2B method to find the stage worth fixing.
By Miljan @ Lead Scorer 10 min read
A sales conversion rate is useful only when everyone knows what converted from what. “Our rate is 18%” could mean leads becoming customers, qualified leads becoming opportunities, or closed deals becoming wins. Those are different denominators, different decisions, and often different time windows.
This guide gives a practical B2B calculation: define a transition, build a cohort, keep pending deals visible, and diagnose the change before prescribing more activity. It works in a CRM export or a spreadsheet; no special dashboard is required.
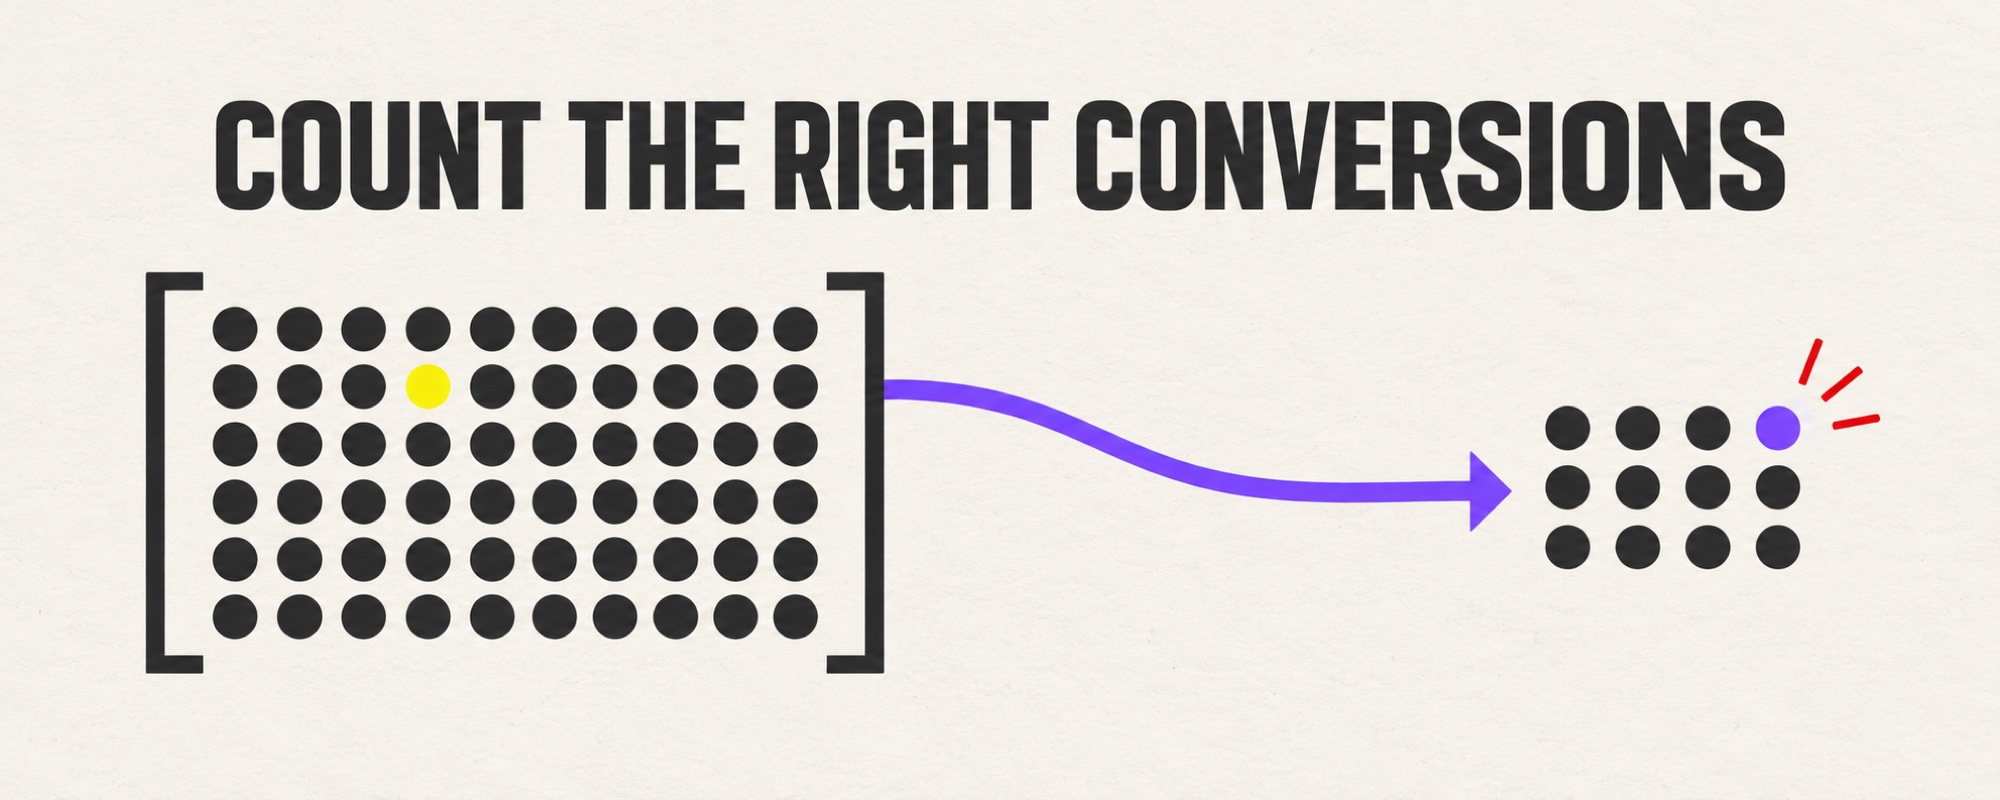
Start with the conversion event, not the percentage
Salesforce describes the broad sales conversion rate as sales divided by leads. That definition is useful for an end-to-end question, but a B2B team usually needs several narrower rates. Pipedrive also separates lead-conversion, funnel-conversion, and won/lost reports. The common lesson is to label each measure before comparing it. Salesforce's calculation guide and Pipedrive's report definitions show why a single number cannot stand for the whole funnel.
- Lead to qualified lead: of leads created in a cohort, how many met the agreed qualification rule?
- Qualified lead to opportunity: of accepted qualified leads, how many became real opportunities?
- Opportunity to won: of opportunities with a final outcome, how many were won?
- Lead to customer: of the original lead cohort, how many eventually became customers?
The third measure is often called win rate. It is not interchangeable with lead-to-customer conversion. If the team needs agreement on what a qualified lead means, settle that first with the lead qualification guide.
Use one formula, with four written rules
Stage conversion rate = records that reached the target stage ÷ eligible records that entered the starting stage × 100.
Write these rules beside the result:
- Unit: unique person, account, or opportunity. Do not count one company twice because two contacts entered the CRM.
- Entry cohort: records that first entered the starting stage during a specified period.
- Observation window: how long each record had to reach the target stage.
- Exit policy: how you treat disqualified, lost, recycled, skipped-stage, and still-open records.
For example, imagine 80 qualified leads accepted in April. By the agreed 90-day observation point, 24 became opportunities, 36 were closed or disqualified, and 20 were still being worked. The observed qualified-lead-to-opportunity conversion is 24 ÷ 80 = 30%. Report the 20 pending records alongside it. The example is illustrative, not a Lead Scorer customer result or a market benchmark.
Do not mix a cohort rate with a calendar-period rate
“Opportunities created in June ÷ leads created in June” is easy to calculate but often wrong for a long B2B cycle. Many June opportunities came from earlier leads; many June leads have not had time to progress. A cohort rate follows the same starting records forward. A calendar-period throughput measure counts activity in the period. Both can be useful, but they answer different questions and must not share one label.
If the sales cycle spans months, compare cohorts only after a consistent maturity window. Otherwise a fresh cohort will look weak because its outcomes are not yet known. See the sales-cycle-length guide for a way to examine the waiting time behind that window.
Keep open deals out of a final-outcome win rate
For opportunities that reached a final decision, calculate closed-won ÷ (closed-won + closed-lost). If “no decision” is a lost outcome in your process, include it consistently. Do not count open deals as losses just because a reporting period ended. Equally, do not hide aged open deals: report their count and age next to the win rate.
If you want to know what happened to opportunities created in one month, use a creation cohort and wait for enough outcomes. If you want a weekly operational snapshot, use outcomes closed that week and label it a closed-period win rate. The two views should not be compared as if their denominators were the same.
Audit the records before diagnosing the funnel
A reported drop can come from a real buyer problem or a recording change. Check a sample of source records before changing the sales motion:
- Were stage entry and exit dates captured, including deals that skipped a stage?
- Did the qualification rule, import process, or source mix change?
- Are duplicate leads or reopened opportunities inflating the starting count?
- Do representatives use the same evidence to mark an opportunity as qualified?
- Are unresolved records old enough to count as pending rather than simply new?
A recent discussion in r/SalesOperations focused on how stale CRM records undermine pipeline analysis. It is one operator discussion, not evidence of a universal failure rate. Use the CRM audit checklist when the source data cannot support the calculation.
Find the constraint, then test one change
Segment a trustworthy rate by lead source, buyer type, deal size, or sales motion. Keep the groups large enough to interpret. Read a small set of advanced and non-advanced records from the same segment. Ask what buyer action or evidence was missing at the transition.
A weak lead-to-opportunity rate may point to broad qualification, slow ownership, or unclear handoff. A weak discovery-to-proposal rate may reflect unresolved buyer needs, not a weak proposal template. A low closed-deal win rate may involve price, competition, timing, or a qualification rule that lets unsuitable deals progress. Test the explanation against actual records before changing scripts or targets.
Choose one intervention, name its owner, and compare a later like-for-like cohort. Keep the absolute counts next to percentages so a swing caused by two deals does not masquerade as a trend. Put the metric and decision in a weekly sales dashboard, but keep the calculation dictionary accessible behind it.
Takeaway
A useful sales conversion rate has a named starting population, a named outcome, a consistent time window, and a transparent rule for unresolved records. Calculate each transition separately, validate the source data, then investigate the stage where a comparable cohort changed.
Need a cleaner starting set of accounts before you measure progression? Try Lead Scorer for free →.
Frequently asked questions
What is a sales conversion rate?
It is the share of a defined group that completes a defined sales action. A lead-to-customer rate, a lead-to-opportunity rate, and an opportunity win rate answer different questions; name both the starting population and the outcome before reporting a percentage.
What is the sales conversion rate formula?
For a defined cohort and transition: number of cohort records that reached the target stage divided by the number eligible at the starting stage, multiplied by 100. State the cohort dates, observation window, and treatment of still-open records.
Should open opportunities count as losses?
No. Open opportunities have not had the chance to produce a final win or loss. For a closed-deal win rate, use closed-won divided by all closed outcomes under a consistent loss rule. For an entry cohort, show pending opportunities separately or wait for the cohort to mature.
What is a good B2B sales conversion rate?
There is no universal rate. It changes with stage definitions, lead source, buyer type, deal size, and sales-cycle length. Compare like-for-like cohorts over time before comparing a public benchmark with your own pipeline.
How do you improve a low stage conversion rate?
First validate the data and stage definition. Then inspect a sample of records that did and did not advance, segment by source and sales motion, and test one process change at the stage where evidence points to a constraint.